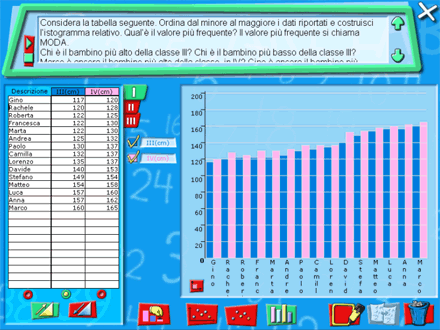
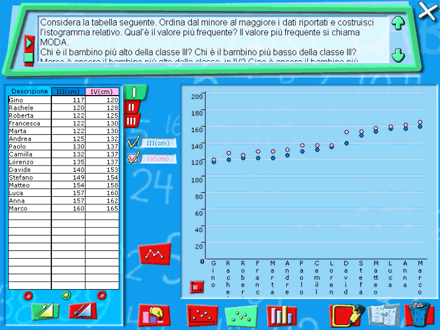
The Graphs Microworld is for planning tables (at most three)
composed of a descriptive column and of at most two columns
of data, to carry out different kinds of graphs.
In the Graphs Microworld is besides possible: to arrange
data in a growing or decreasing way, to choose the kind
of graph that is to be realized (histogram, dot graph, correlation),
to choose the unit for the graph, to choose the construction
method of the graph (manual or automatic), to import data
from the Spreadsheet.
The graphs and the tables can be copied to be pasted on
the Solution Sheet.